Comparing my LD rankings to each other
Now that I’ve participated in three Ludum Dares with (mostly) completed games, I thought it was about time I rank them against each other, finding out what’s improving, what’s not, and how to use Excel. Luckily, I quickly figured out how to use Excel.
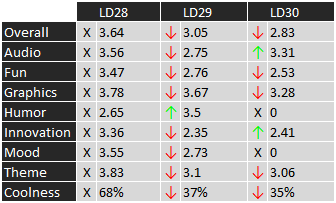 Scores
This first chart is comparing my games based on their rankings in each category. A green arrow means my score was higher, a red arrow means my score was lower, and an ‘X’ means that I can’t judge whether it was higher or lower. I would start talking about the differences in my games now, but there’s a much better, more accurate way to represent the data:
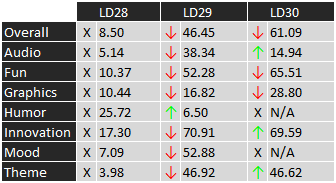 Percentages (Compo)
Percentages! (Coolness isn’t there because I couldn’t find the ranking for my LD28 entry, messing the whole thing up.) Now the data represents the top percentage of games I was in during each compo, and is less affected by the number of games entered. So for overall is LD28, I was in the top 8.50%, or above 91.5% of other developers. To do this, I just divided the ranking my games had in each category by the number of games in each compo (ex. LD28 had 1283 compo entries, and my game was #51 for theme, so I did 51/1283=3.98). I also made one for overall percentages, as shown below.
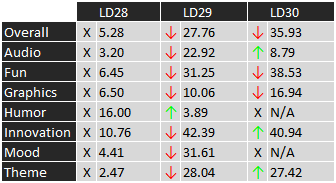 Percentages (Overall)
The strangest thing here is that my LD28 entry actually ended up being the better than my two other entries, except in humor. This is most likely because my LD29 game lacked a difficulty curve and much gameplay, and my LD30 game lacked… well, a lot (I’m definitely never letting myself run out of time again).
I’m not really sure what else to talk about here, so if there’s anything you want to know, ask away in the comments! Alternatively, you can just play the games and find your own conclusions.
Here are links to all of my games:
[LD28 – CHOOSE W1SELY]
[LD29 – Neath: Surf Ace]
[LD30 – Two Worlds]