Infographic: Survey Results
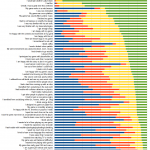
Participants of Ludum Dare 22 were asked to fill out a survey on their experience. A whopping 747 people filled out the survey.
Thanks for taking the time to fill it out!
I love this enthusiastic and supportive community.
Here are the results (click to zoom).

Survey Results: click to zoom in.
An in-depth analysis of the data will appear in the upcoming book, the Game Jam Survival Guide. Briefly, people had a lot of fun. The majority were either first-timers or not experienced game jammers. Most are happy with their games, of which about half work in a web browser. In order to finish on time many people had to cut features and simplify their designs. Not everyone was as familiar with their tools or basecode as they should have been, but only a few tried to learn a brand new engine.
Most games did not run on mobile devices, but many were cross-platform. On average most people did not spend time watching TV or movies, going outside, visiting with friends or playing other games.
Contrary to expectations, almost nobody drank coffee, energy drinks or alcohol. Virtually nobody used version control (such as SVN) or time-management techniques (such as pomodoro). Surprisingly, not many reported having difficulty with packaging, installers or submitting.
This infographic would be complemented by additional stats work. For example sorting the results by the most common response, or by questions with the most “no, not at all” answers would show some interesting trends that aren’t hinted at in this chart. Overall, however, even this cursory examination of the 747 survey results sheds some light on how Ludum Dare game jammers spend their weekends.
Tags: infographic, McFunkypants, postmortem, tips